RNA co-localization with cellular granules
Workflow to quantify the co-localization between RNA clusters and cellular granules.
- FISH-quant to detect RNA positions.
- ImJoy: you can install the plugin from here.
ImJoy plugins will be available in the workspace: rna-loc-elegans
You will also need the ImJoy plugin engine, please consult the ImJoy documentation
Analysis overview
Co-localization between RNA clusters and granules is estimated. RNA detection is performed in FISH-quant. The rest of the analysis in a dedicated ImJoy plugin.
-
RNA clusters are identified by first analyzing smFISH images with FISH-quant and then performing a DB-scan. In order to spatially resolve close RNAs, we use our approach the decompose close RNAs (see section on RNA detection). The RNA detection results are then analyzed with the DB-scan approach.
-
Granules are detected with a blob detection method (https://scikit-image.org/docs/dev/auto_examples/features_detection/plot_blob.html). The user can adjust a threshold for the detection of these blobs.
Spatial overlap of clusters and granules is then computed.
Data organisation
We enforce the following data organisation for this analysis.
- One folder per multi-channel image ('sample folder').
- Each channel is saved as a separate
.tiffile containing all z-slices. Information for how to convert stacks can be found here are here. - Channels containing smFISH data are in a sub-separate folder. RNA molecules are detected with FISH-quant. Analysis results are also stored directly in the sample folder. RNA detection is described in more detail here.
- All other channels (Granules, DAPI) are in the parental sample folder
As an example, we have one image img1 with 4 channels. The first two channels contain
analysed smFISH data, the third one contains the image of the granules, and the 4th the DAPI image.
    .
    ├─ img1/
    │  ├─ C3-img1.tif                          # Granules image
    │  ├─ C4-img1.tif                          # DAPI image
    │  ├─ C1/                                  # CHANNEL 1
    │  │  ├─ C1-img1.tif                       # smFISH image
    │  │  ├─ C1-img1__settings_MATURE.txt      # FQ detection settings
    │  │  ├─ results_GMM/                      # Spot decomposition results
    │  │  │  ├─ C1-img1_res_GMM.txt
    │  ├─ C2/                                  # CHANNEL 2
    │  │  ├─ C2-img1.tif                       # smFISH image
    │  │  ├─ C2-img1__settings_MATURE.txt      # FQ detection settings
    │  │  ├─ results_GMM/                      # Spot decomposition results
    │  │  │  ├─ C2-img1_res_GMM.txt
    │  ├─ coloc_granules/                      # Analysis results
    │  │  ├─ Channel_C1/                       # Results for channel 1
    │  │  │  ├─ ....
    │  │  ├─ Channel_C2/                       # Results for channel 2
    │  │  │  ├─ ....
    .
RNA detection
Please consult the dedicated section here.
Analysis in ImJoy
The entire functionality of the plugin can be controlled within the plugin window. If you expand the plugin, you will see all parameters and operations that can be performed.
Defining a FQ results file
In the first field, you can copy&paste the FULL file name of the FQ results file, that you want to analyze. e.g.
C1-img1_res_GMM.txt in the example above.
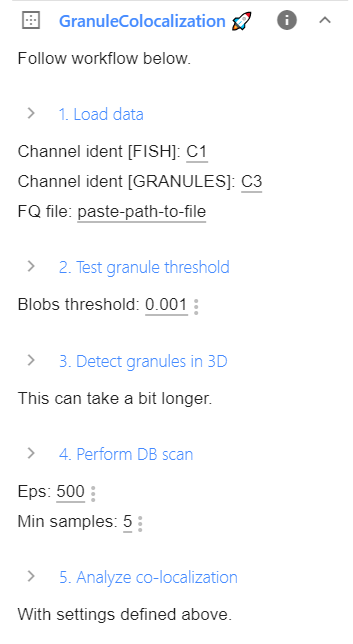
Loading data
Here the FQ results and all image data are loaded. You have to specify the strings that specify the smFISH image and the
granules image. For example, C1 and C3 for the data-set explained above.
Once these parameters are specified, you can click on Load data. Here, the specified FQ results file will be used to load
all necessary data.
Important: make sure that the channel identifiers are correct, if you analyze another FISH channel.
Granule detection
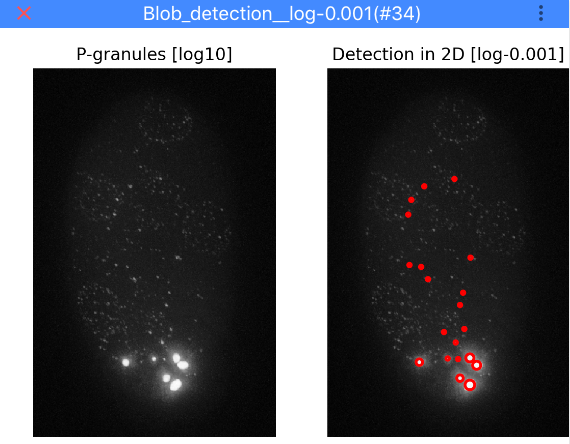
Here, you can specify a threshold to detect granules. Lower value results in more detections. Click Test granule threshold
to apply the currently selected threshold. Note that for testing thresholds the analysis is only performed on a 2D
maximum intensity projection (otherwise it takes too long). Once the detection is finished, ImJoy will display a
window with the results as shown below.
Once you identified a good threshold, you can click on Detect granules in 3D, to perform the analysis on the full 3D image.
Note: if you load a new FISH results from the same sample, you don't need to redo the granule detection. The ImJoy plugin stored the last analysis, and it can be reused. In this case, you only have to readjust the DB-scan parameters.
DB-scan
In order to identify RNA clusers, we anlalyze the 3D RNA positions with a DB-scan. Here you have to set two parameters
Here spatial clusters are called based on two criteria (1) maximum allowed distance
* eps: maximum allowed distance between spots within a cluster
* Min samples: minimum number of spots to be considered as a cluster
You can change these values and then perform an analysis by pressing on Perform DB-scan. ImJoy will again show an image
with the analysis results.
Co-localization analysis
Once you are satisfied with the results, you can determine the co-localization between RNA clusters and
granules by pressing Analyze co-localzation.
Stored results
The analysis script will create a folder coloc_granules in the sample folder. Here a separate folder for each
analyzed channel is created. A number of images and csv files summarizing the analysis will be stored.
iD_blob_detection__ABC-XYZ.png: results of the blob detection.iD: dimension of analyzed image (2D or 3D).ABC: blob detection method. Currently onlylogis supported.XYZ: detection threshold.
COMPARE_granules_clusters.png: results of the coloc analysis. See also image below.- 1st first row is is the granule image, 2nd row the FISH image.
- 2nd column shows detected granules or RNA clusters.
- 3rd column shows granules/clusters in a color-code to indicate if the co-localize or not.
DB_scan_eps-ABC__min-samples-XYZ: results of the DBSCAN.ABC: usedeps.XYZ: used minimum number of samples.
img_ABC_XyZ.tif: mask or label images of granules or RNA clusters.ABC: granules or RNA clustersXYZ: eitherlabel(each object has a unique pixel intensity), ormask(all objects have pixel intensity 1)
Intensity_vs_clustering.png. Show the number of RNAs per cluster, or mean granule intensity as a function of being co-localized or not.ABC.csv: properties of granules and clusters such as position, size, or co-localization. These file can be used to summarize multiple images.ABC: granules or RNA clusters
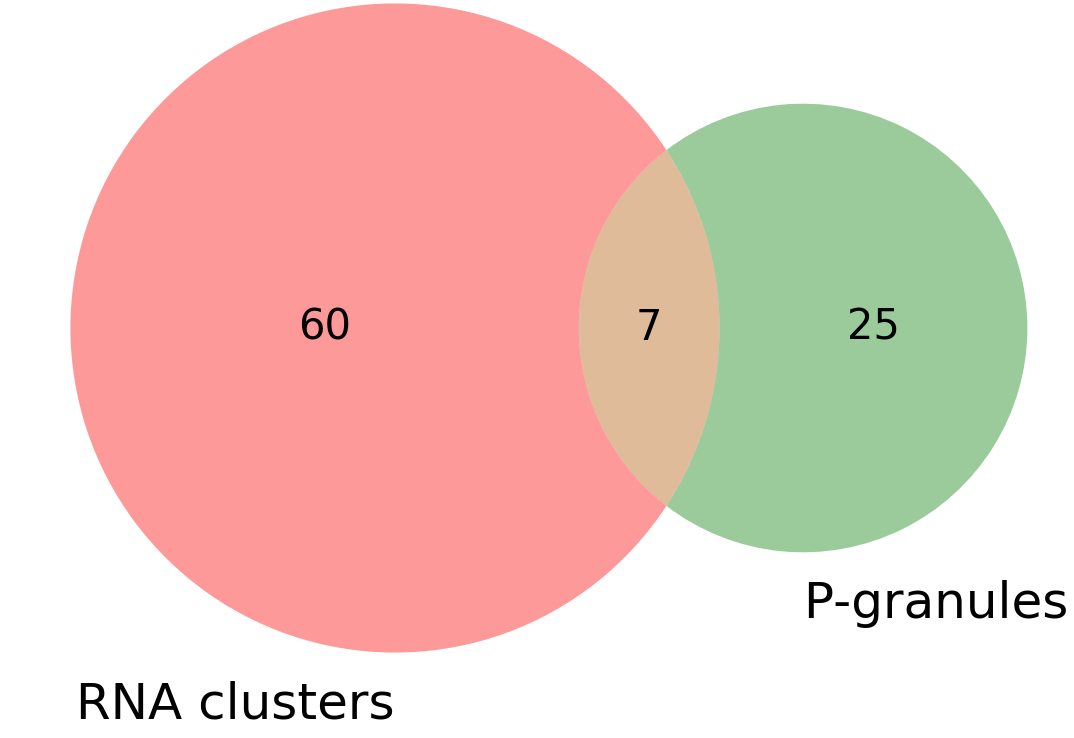
VENN_diagram_overlap.png:: VENN diagram showing total number of clusters/granules and how many co-localize.
